If you’ve worked with Dynamics 365 Customer Insights – Journeys for more than five minutes, you’ll know this:
👉 It’s brilliant at executing campaigns
👉 It’s not brilliant at tracking money
And yet… the first question every business asks is:
“How much did this campaign cost us—and what did we get back?”
So let’s talk about how to actually solve this properly—without turning your CRM into a finance system.
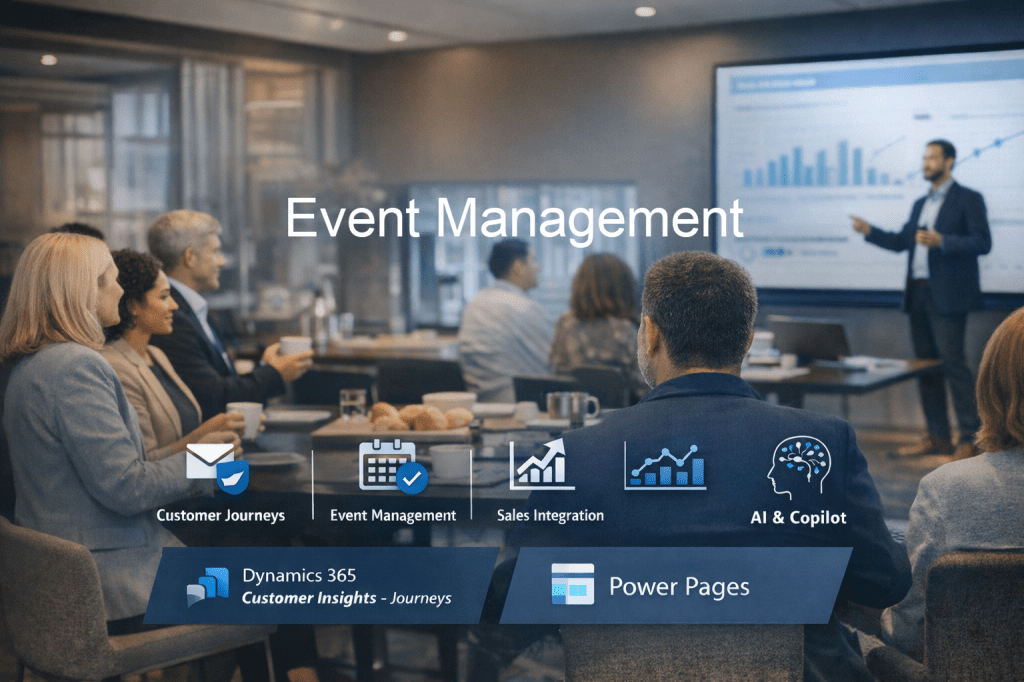
🎯 The Reality: Customer Insights Journeys Wasn’t Built for Budgeting
Customer Insights – Journeys gives you:
- Segments
- Emails
- Journeys
- Engagement analytics
What it doesn’t give you (natively):
- Campaign budgets
- Cost tracking
- ROI visibility
👉 Which means if you don’t design this intentionally…
You end up with beautiful journeys and zero financial insight
🧠 The Smart Approach: Add a Lightweight Financial Layer
You don’t need a massive custom solution.
You need a simple, structured model in Dataverse that sits alongside your marketing execution.
Think of it as:
“Just enough finance to make marketing accountable”
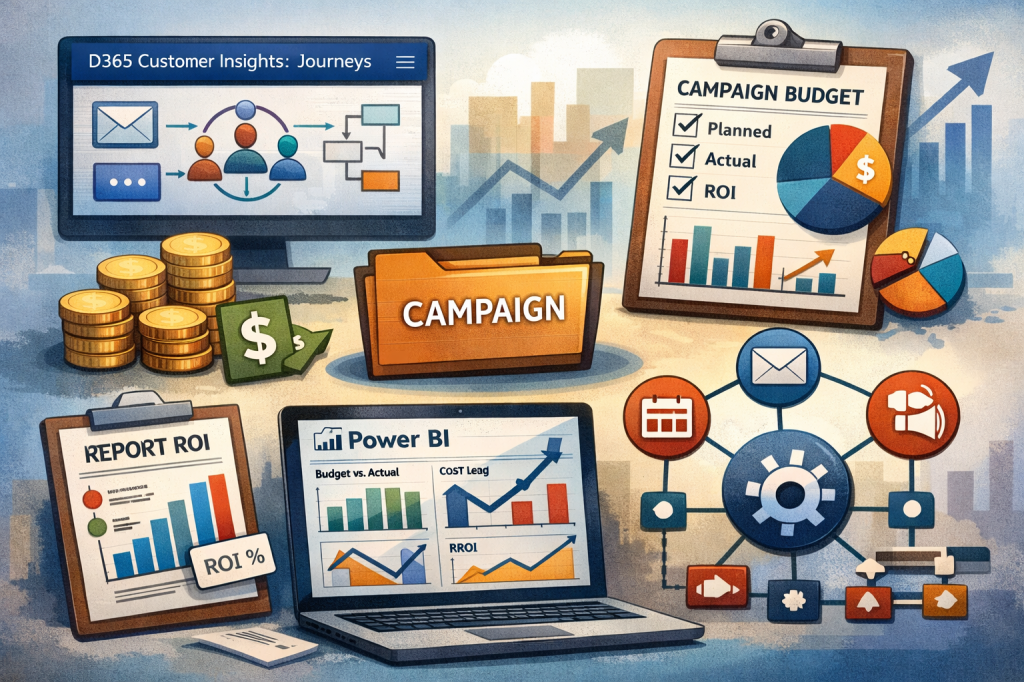
🧩 Step 1: Make Campaign the Centre of Everything
This is where most implementations fall apart.
Your campaign should be the single source of truth.
Everything must link back to it:
- Journeys
- Emails
- Events
- Forms
👉 If it’s not linked to a campaign…
…it doesn’t exist from a reporting perspective.
💰 Step 2: Track Budget vs Actual (The Right Way)
You’ve got two options here:
Option 1 – Quick Win (MVP)
Add a few fields to Campaign:
- Budget Allocated
- Budget Spent
- Remaining Budget
- Forecast Revenue
- Actual Revenue
✔️ Fast
✔️ Simple
❌ Limited (no breakdown, no audit trail)
Option 2 – Proper Model (What I recommend)
Create two small tables:
Campaign Budget
- Planned vs Approved vs Actual
- Channel (Email, Event, Social)
- Time period
Campaign Costs
- Cost type (Media, Agency, Tools)
- Amount
- Linked campaign
👉 This gives you:
- Real visibility
- Channel-level insights
- Clean reporting
- Scalability (without complexity)
🔗 Step 3: Connect Marketing Activities to Spend
This is the magic step.
Add a Campaign lookup to:
- Emails
- Journeys
- Events
- Forms
Now you can answer questions like:
- Which journeys drove results?
- Which channels are expensive vs effective?
👉 Without this link… your reporting is guesswork.
📊 Step 4: Turn Data into Insight (Power BI)
This is where Power BI comes in.
Build a simple dashboard:
- Budget vs Actual
- Spend by channel
- Leads generated
- Conversion rate
- Cost per lead
- ROI %
👉 Combine:
- CIJ engagement data
- Dataverse budget + cost data
Now you’re not just running campaigns—you’re managing performance
⚙️ Step 5: Automate the Boring Stuff
Use Power Automate to:
- Roll up total spend to the campaign
- Trigger alerts when budget thresholds are hit
- Update performance summaries
- Keep data clean and consistent
👉 This is low effort, high impact.
🚀 Step 6: Where We Can Really Add Value
You can take this further by:
- Integrating with finance systems (e.g. Business Central)
- Adding revenue attribution
- Introducing AI-driven insights
- Building campaign performance scorecards
But here’s the key:
Don’t start here.
Start simple. Prove value. Then scale.
💬 Final Thought (The One That Matters)
Most organisations don’t have a technology problem.
They have a visibility problem.
Customer Insights – Journeys gives you the execution engine.
👉 You bring the structure that makes it accountable.
And that’s where the real value is.
If you’re working with Customer Insights Journeys and want to:
- Design a clean campaign tracking model
- Build a demo-ready Power BI dashboard
- Or level up your marketing operating model
Get in touch! 👍


Leave a comment